Fragments from six consoles. Or the full story from one platform.
Endpoint logs. Network traffic. SIEM alerts. Your security team stitches these together manually to reconstruct what happened in the browser. Neon delivers the complete story — in real time.
SecOps and GRC teams are drowning in fragmented data. Every investigation requires manually correlating logs across multiple consoles but still unable to answer a simple question: what actually happened in the browser? Traditional security tools weren’t designed to tell that story.
Console hopping kills efficiency
A single investigation touches your SIEM, your EDR console, your email gateway, and your DLP dashboard. Your analysts spend more time stitching data together than analyzing threats.
Alerts without context
You get an alert that sensitive data was detected. But what was the user doing? What site were they on? What did they type? What happened before and after? Your tools can’t answer these questions.
Governance is non-linear
Audit preparation means pulling reports from six different tools, reconciling data formats, and piecing together a timeline that is missing critical information. Demonstrating AI governance to regulators today is a spreadsheet exercise at best.

Full-session browser telemetry for detection and governance.
Neon gives your security and compliance teams what they’ve never had: the complete, contextual story of every browser session. Every time someone clicked on a link or entered data into a prompt, whether they were pasting data or uploading or downloading files — with the context to understand what it means.
Session-level telemetry
Full visibility into every browser session — what happened, in what order, with what data, on what site. No more reconstructing events from fragments across multiple tools.
Detection-ready signals
High-fidelity, contextual events that feed directly into your SIEM and SOAR workflows via API. Rich enough to act on immediately, not raw logs that need another layer of interpretation.
Audit-ready reporting
Get a detailed forensic timeline for compliance reporting that demonstrates AI governance, policy enforcement, and risk posture — with real data from real browser sessions, not self-reported surveys.
Built for your team
The Post-Click Gap
Every browser-related incident costs your team hours of manual log correlation and you still don’t fully know what happened. You need browser telemetry that arrives pre-contextualized and SIEM-ready — not another raw data source to normalize.
The Audit Scramble
When a regulator asks for evidence of AI governance, you spend weeks pulling together data from tools that were never designed to answer that question. You need data and reporting that exist already — generated automatically from real session data, not assembled by hand.
Unlock the potential with Neon Cyber
Stop reconstructing browser activity from six fragmented sources. Neon delivers the complete session timeline in one place — context included.
Browser events arrive enriched with context — not raw logs. Your analysts spend time on decisions, not data normalization
When regulators ask how you govern AI usage, your answer is a report — generated from real session data — not a self-attestation built on hope.
Browser telemetry from Neon consolidates what previously required correlating across your SIEM, EDR, DLP, and email gateway simultaneously.
Trusted by the best
Everything you need to know about Neon Cyber's capabilities and deployment
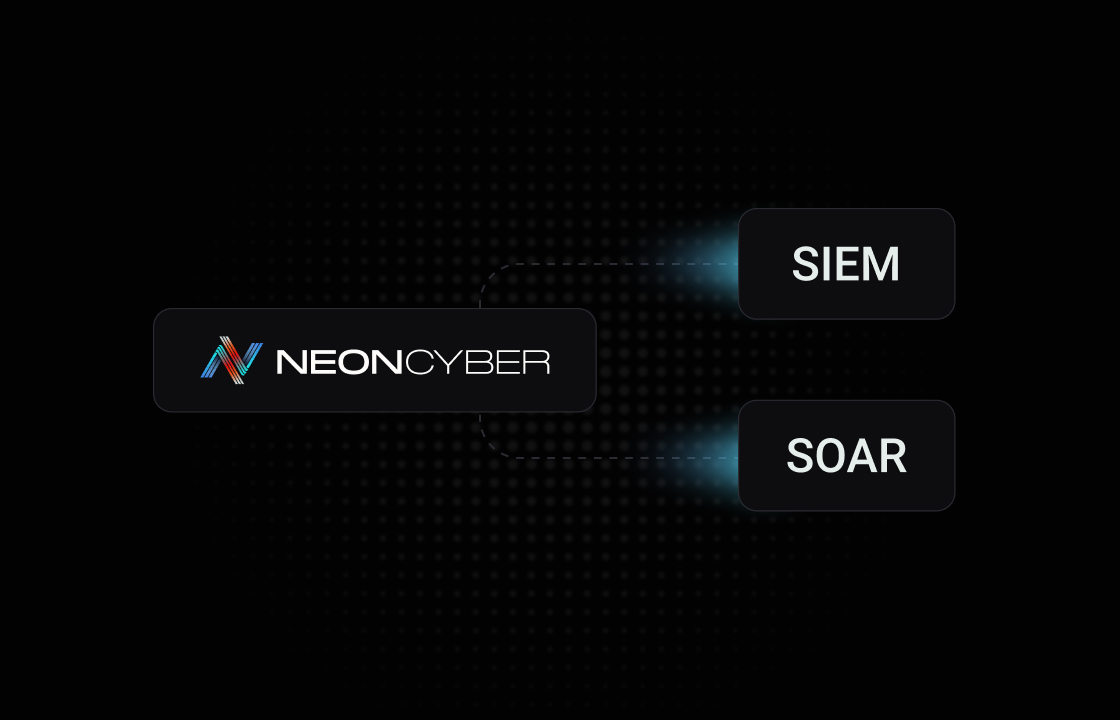
Neon is designed as a complementary layer — not a replacement for the security tools your team already operates. It closes the browser visibility gap that SIEM and SOAR tools cannot address on their own, and is built to feed that browser-layer telemetry directly into the workflows your security operations team already uses.
Neon easily integrates with leading SIEM platforms via an API, with deeper integrations developed for Elastic, enabling security teams to ingest browser activity events alongside endpoint, network, and cloud telemetry for unified threat hunting and investigation.
Events from Neon — detections, policy triggers, authentication anomalies, and SaaS access activity — are available as structured log data that maps cleanly into existing SIEM schemas.
SOAR integration enables automated response workflows triggered by Neon detections — for example, automatically escalating a high-confidence phishing detection or flagging a sensitive data exfiltration event for immediate analyst review. Speak with our team to discuss integration options for your specific security stack.
For EDR, Neon complements rather than competes: your EDR handles endpoint and process-level threats; Neon handles the browser session layer that sits above the endpoint and below the application, which existing EDR tools have no visibility into.
Most security investigations hit the same wall: the evidence trail ends at the network perimeter. You can see that a user connected to a destination. You can see DNS resolution timestamps and firewall logs.
What you can't see is what happened inside the browser session when they got to their final destination — where they actually landed, what they typed, what they submitted, what files were uploaded, what credentials were entered, and whether any of it constituted a genuine threat or a false positive you're about to spend three hours chasing.
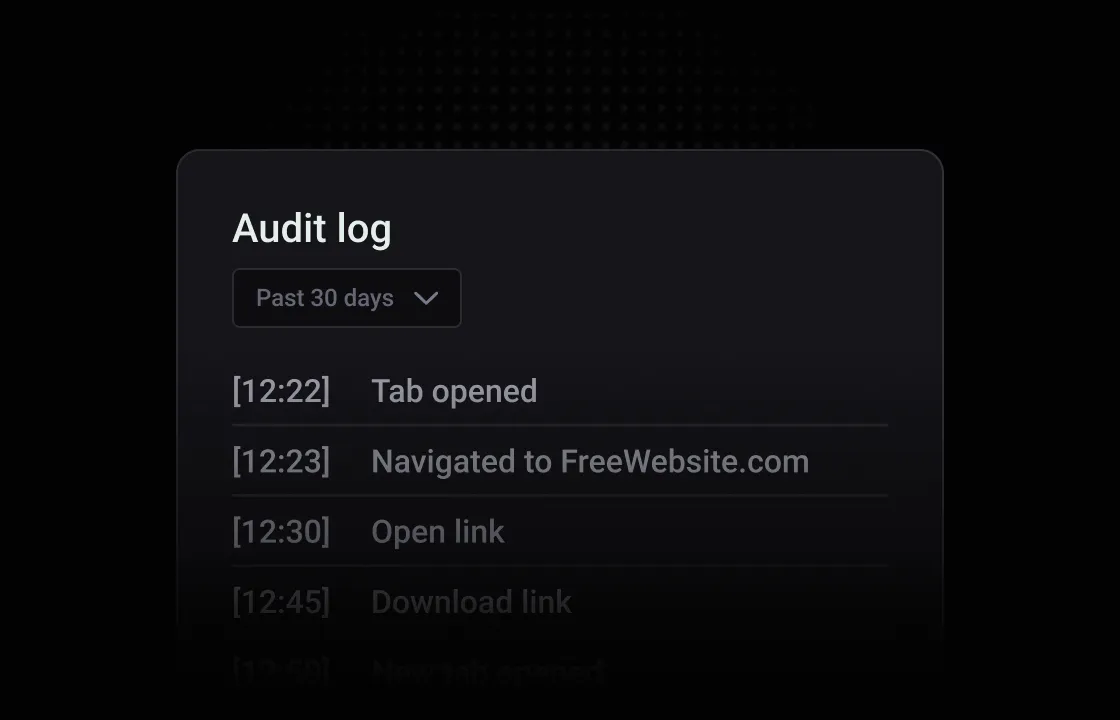
Neon closes that gap by giving investigators a complete forensic timeline of browser-level activity — not just metadata, but the full sequence of events as they unfolded at the point of user interaction.
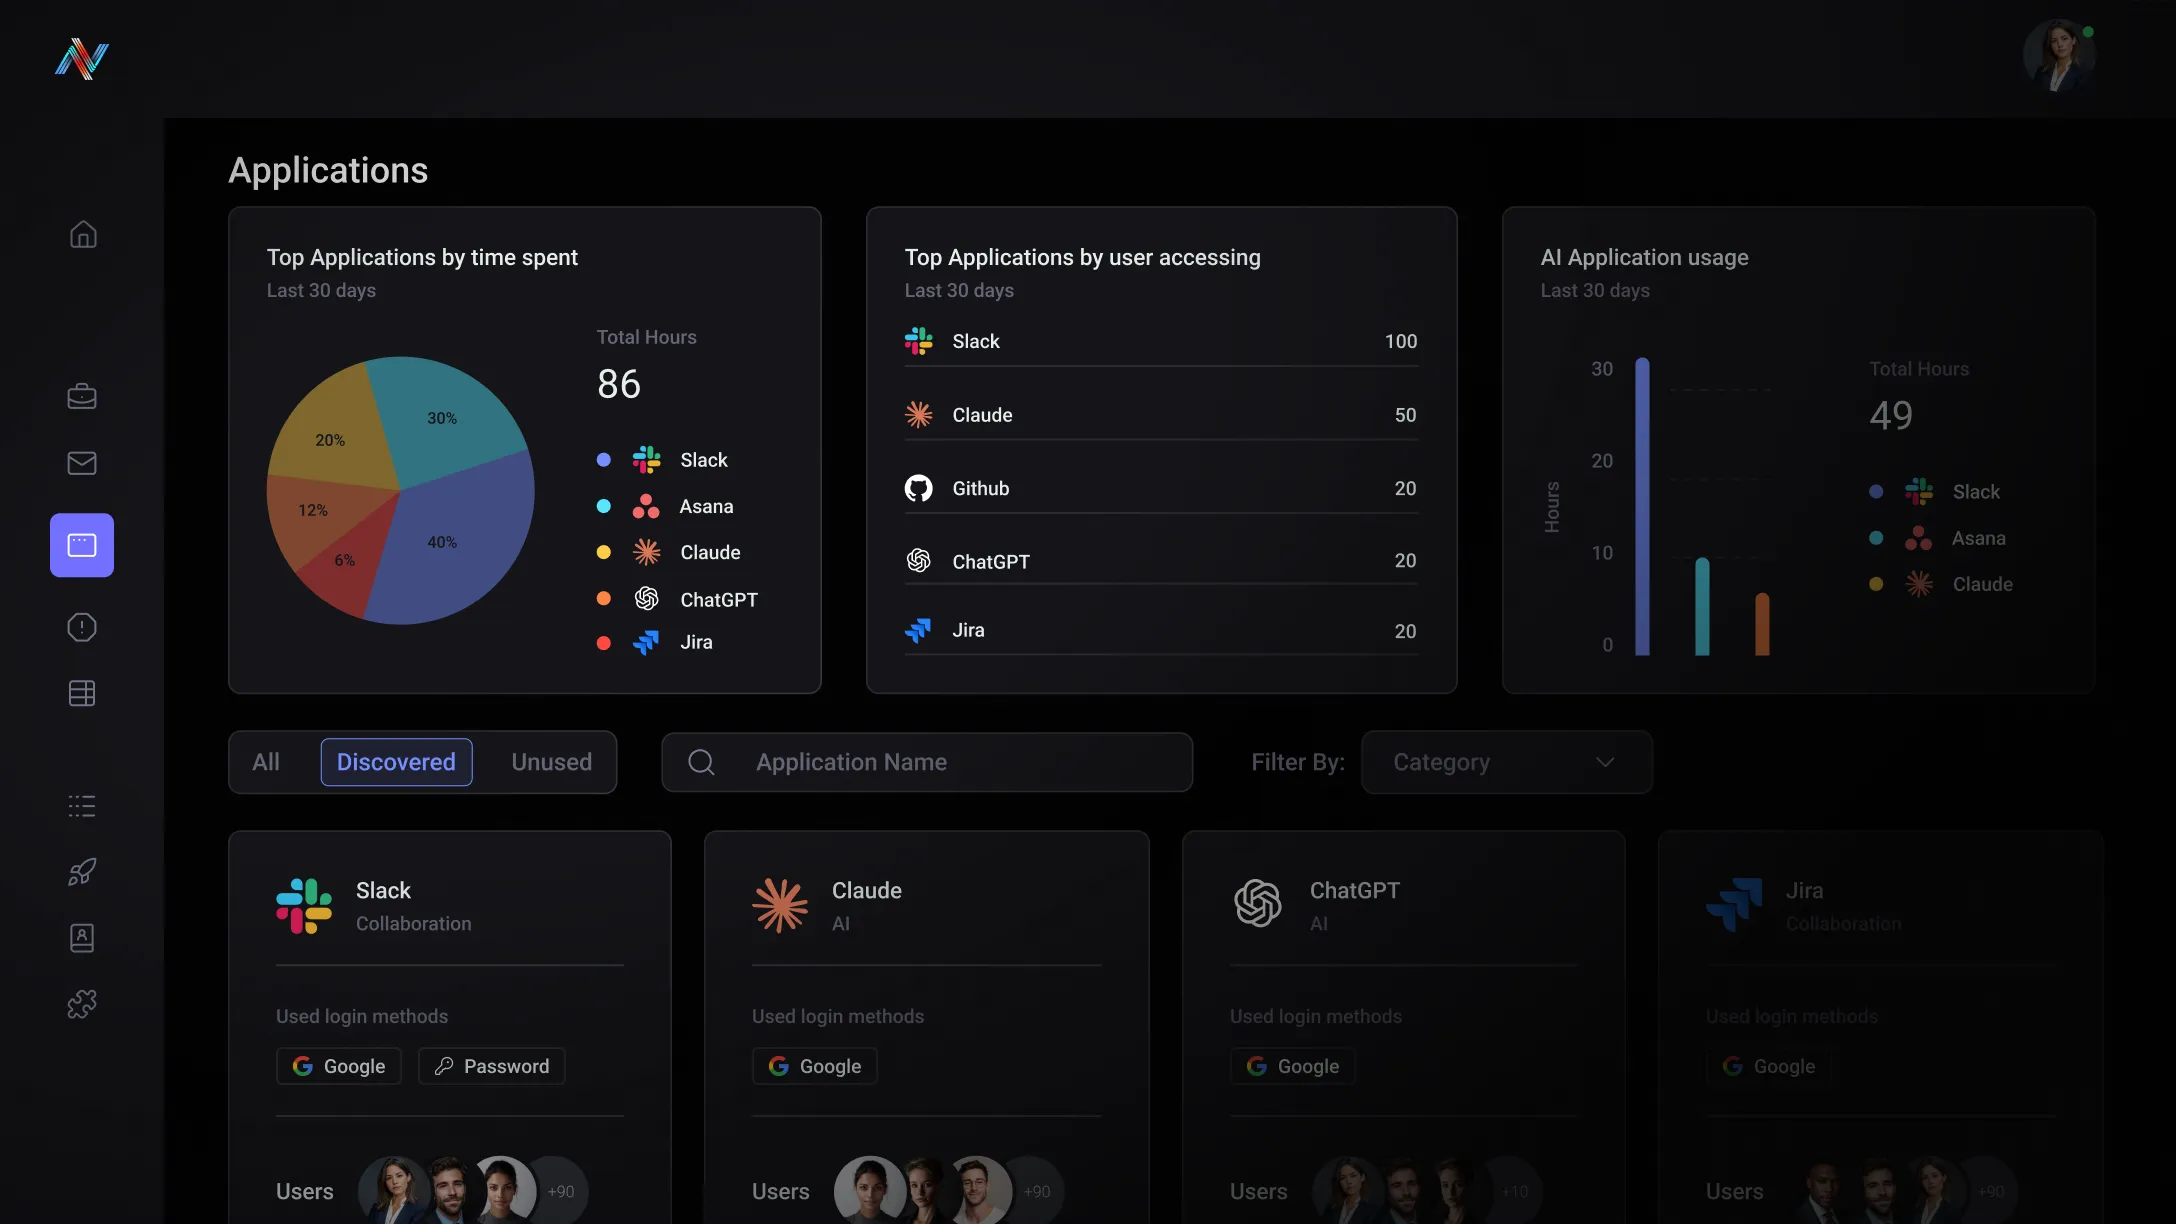
When a security team opens an investigation with Neon, they can see exactly which applications a user accessed, how they authenticated, if credentials were entered into forms and prompt fields, what files were uploaded, and the precise chain of events that led from initial access to the activity under review.
This matters most in the scenarios where existing tools provide the least visibility:
- credential theft investigations where the breach source is unclear
- insider threat cases where you need to distinguish between deliberate exfiltration and accidental data handling
- phishing incidents where you need to reconstruct what the user did after they clicked
- shadow AI exposure events where you need to understand the full scope of what data left the organization and through which channels
For GRC teams, the same telemetry that supports investigation also supports audit. Every policy trigger, authentication event, and flagged interaction is captured as a structured event record — giving compliance teams the audit trail they need to demonstrate enforcement to regulators without requiring a manual review process to reconstruct what happened after the fact.
Neon also integrates with your existing SIEM, so browser-layer events can be correlated alongside endpoint, network, and cloud telemetry in the platform your security operations team already works from — meaning Neon adds a new source of high-fidelity evidence to investigations without creating a separate workflow to manage.
SASE and network monitoring tools observe traffic. Neon observes behavior. That distinction sounds subtle, but it isn't.
SASE platforms operate at the network layer, sitting between the user and the internet to inspect traffic, enforce policies, and log connection events. They're highly effective at what they were built for: controlling network access, filtering destinations, and applying policy at the perimeter.
But the observability of SASE solutions has a structural ceiling — they see the request and the supposed destination, not the actual destination or what happened on the page.
Say a user visits a legitimate file-sharing platform, uploads a sensitive document, and walks away generates a clean network log. The SASE tool sees an allowed connection to a trusted domain. At the network layer, this looks benign but the file uploaded actually violates your policy. The actual risk event — the file upload, its contents, the identity used — is invisible.
The deeper problem is encryption. Modern browser traffic is encrypted end-to-end, which means SASE and secure web gateways that want to inspect content must perform SSL decryption — intercepting and re-encrypting traffic through a proxy. It's technically possible, but it's operationally painful, introduces latency, breaks certificate pinning for certain applications, creates a single point of failure in the network path, and still doesn't give you visibility into what happens inside the session once the page loads. What a user types into a form field, what they paste into an AI prompt, what they enter into a credential harvesting page — none of that is captured by traffic inspection, even with SSL decryption enabled.
Neon operates from the opposite end of the architecture. Rather than intercepting traffic from outside the browser, Neon sits inside the browser session itself — after decryption has already occurred, at the layer where user interactions actually happen.
Neon sees form inputs, prompt content, file uploads, clipboard activity, authentication flows, and the full behavioral context of every session. It captures this without a network proxy, without SSL decryption overhead, and without creating a single point of failure in your connectivity stack.
The result is a fundamentally different quality of observability. SASE tells you where users went. Neon tells you what they did when they got there — which is the data that actually matters when you're investigating an incident, enforcing a data handling policy, or trying to answer a GRC auditor's question about what your organization's browser-based risk exposure actually looks like.
Neon governs the browser layer — above the network perimeter — because network tools cannot reach it, while the browser is becoming the most consequential place where security events occur.
Give your SOC the full story. Give your auditors real proof.